by Sam Hampton
Several articles in the past few months that I encountered centered on the importance of ROR (rate of rise) when roasting coffee. After reading just one it was like eating potato chips, l could not stop. Over the past few months, I started comparing my data on ROR with what I was finding online.
I still roast in the perfect roasting apparatus, a converted bread machine using a heat gun. I added two switches and a temperature probe at a cost of fewer than twenty dollars to a bread machine I picked up at a thrift store for $3.50. It took about an hour to convert and that was about two and a half years ago and many happy roasts since.
I started Googling ROR and looking at the ROR Image lines on roasting charts. I did this for temperature curves several years before when looking at the roasting temperature, but did not focus on the ROR output lines at that time. This time, I noticed one thing right off the bat when comparing my ROR lines with other ROR chart lines I found online. For the most part, the chart lines on most of the charts were a squiggle of descending lines, which to me were meaningless. I could only see the Natural Roasting Profile, which allows the ROR to drop as the coffee beans lose moisture and dry out when roasting.
The drier the bean gets, the less heat it can absorb. This is a descending endothermic process that all roasting coffee beans exhibit when roasted. This continues from the start of roasting to the point where the first crack ends. Most of the free moisture is lost in the first three minutes of roasting up to the point of 100 °C (212°F). Then deeper internal free moisture is started to be removed during the Maillard process from 130 °C to 170 °C. This is evidenced by the changes in the color of the beans from green to yellow and then brown. The final free moisture is removed in the development stage up to and through the end of the first crack of the roasting process. The beans have been roasted at this point to a city plus or full city level. This is the point where the beans stop being endothermic and become exothermic.
This is easily reasoned and documented by keeping good data during the roast. The reason this does not show up clearly on most roasting charts is that there is too much data being processed. ROR by the minute does not need a fancy algorithm or complicated math to be determined. ROR is the difference in the bean temperature from the last minute to the next minute by simple subtraction.
Heat transfer can be documented by anyone with a hot cast iron skillet and a pot holder. If the pot holder is wet, the hand will let you know very quickly that the heat transfer is quicker when there is moisture present in the pot holder. A dry potholder can safely pick up the skillet. Coffee beans, when they contain a lot of moisture, can react to absorb heat and thus evaporate that moisture. As the beans dry out, they lose the ability to evaporate the moisture. This is the Natural Roasting Profile.
There is a definite point in the ROR chart line that shows when the process changes from endothermic to exothermic. I call it the “kick.” If a simple data set is kept of the ROR temperatures by the minute, the ROR will stop falling and start increasing. This can be seen plainly when the roasting heat and other roasting factors are held constant; the ROR will jump on its own.
The charts below show clearly the “kick”.

Chart 1
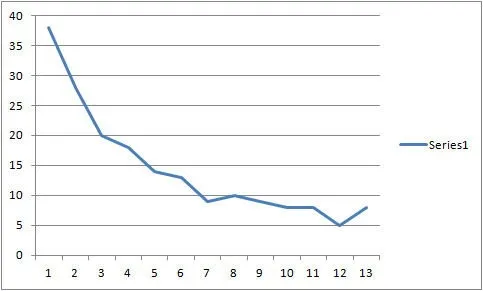
Chart 2
This same “kick” can be seen on many of the roasting charts online, even with an overabundance of data and manipulation of heat and other roasting factors. I can monitor my roasts by manually recording temperature by the minute and calculating ROR in my head.
I roast only Kenyan AA and Ethiopian dry-process beans. I use a heat gun to provide the temperature and air. I use a router control to make minor adjustments to the heat and air during the roast, and I reduce or increase heat to create the roast profile, switching from high to low depending on how quickly the beans dry out. The profiles do not have a lot of variance, and this gives me consistent results. Roasting to the “Kick” gives me a way of knowing that I have roasted to my desired roast level, which I check and confirm by weight.
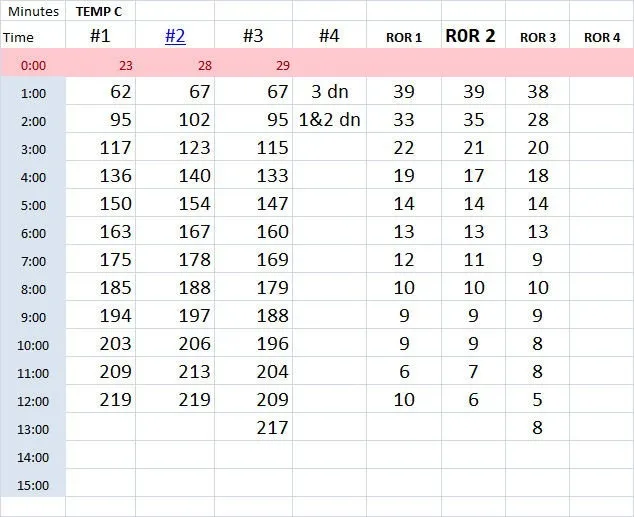
Chart 3
The data above is the entry section of the New Minute Green Bean Logger template chart for the Excel spreadsheet program. Temperature data is recorded manually during roasting and entered into the spreadsheet for archive and analysis. Temperature is entered into columns 1 to 4, and the ROR data is automatically calculated from the temperature data. In this roast, batch 2 was pulled before the kick occurred. Batch 3 was pulled when the temperature reached 217 °C, when the kick was observed. An unchanging reduced heat gun setting was maintained from 2 minutes to the end of the roast.
The Green Bean Logger is a free spreadsheet template I created for Microsoft Excel. It is not free-standing; it is only a template, and a copy of Excel is needed to use it.
For your reference, below is a screenshot of the New Minute Green Bean Coffee Logger template.
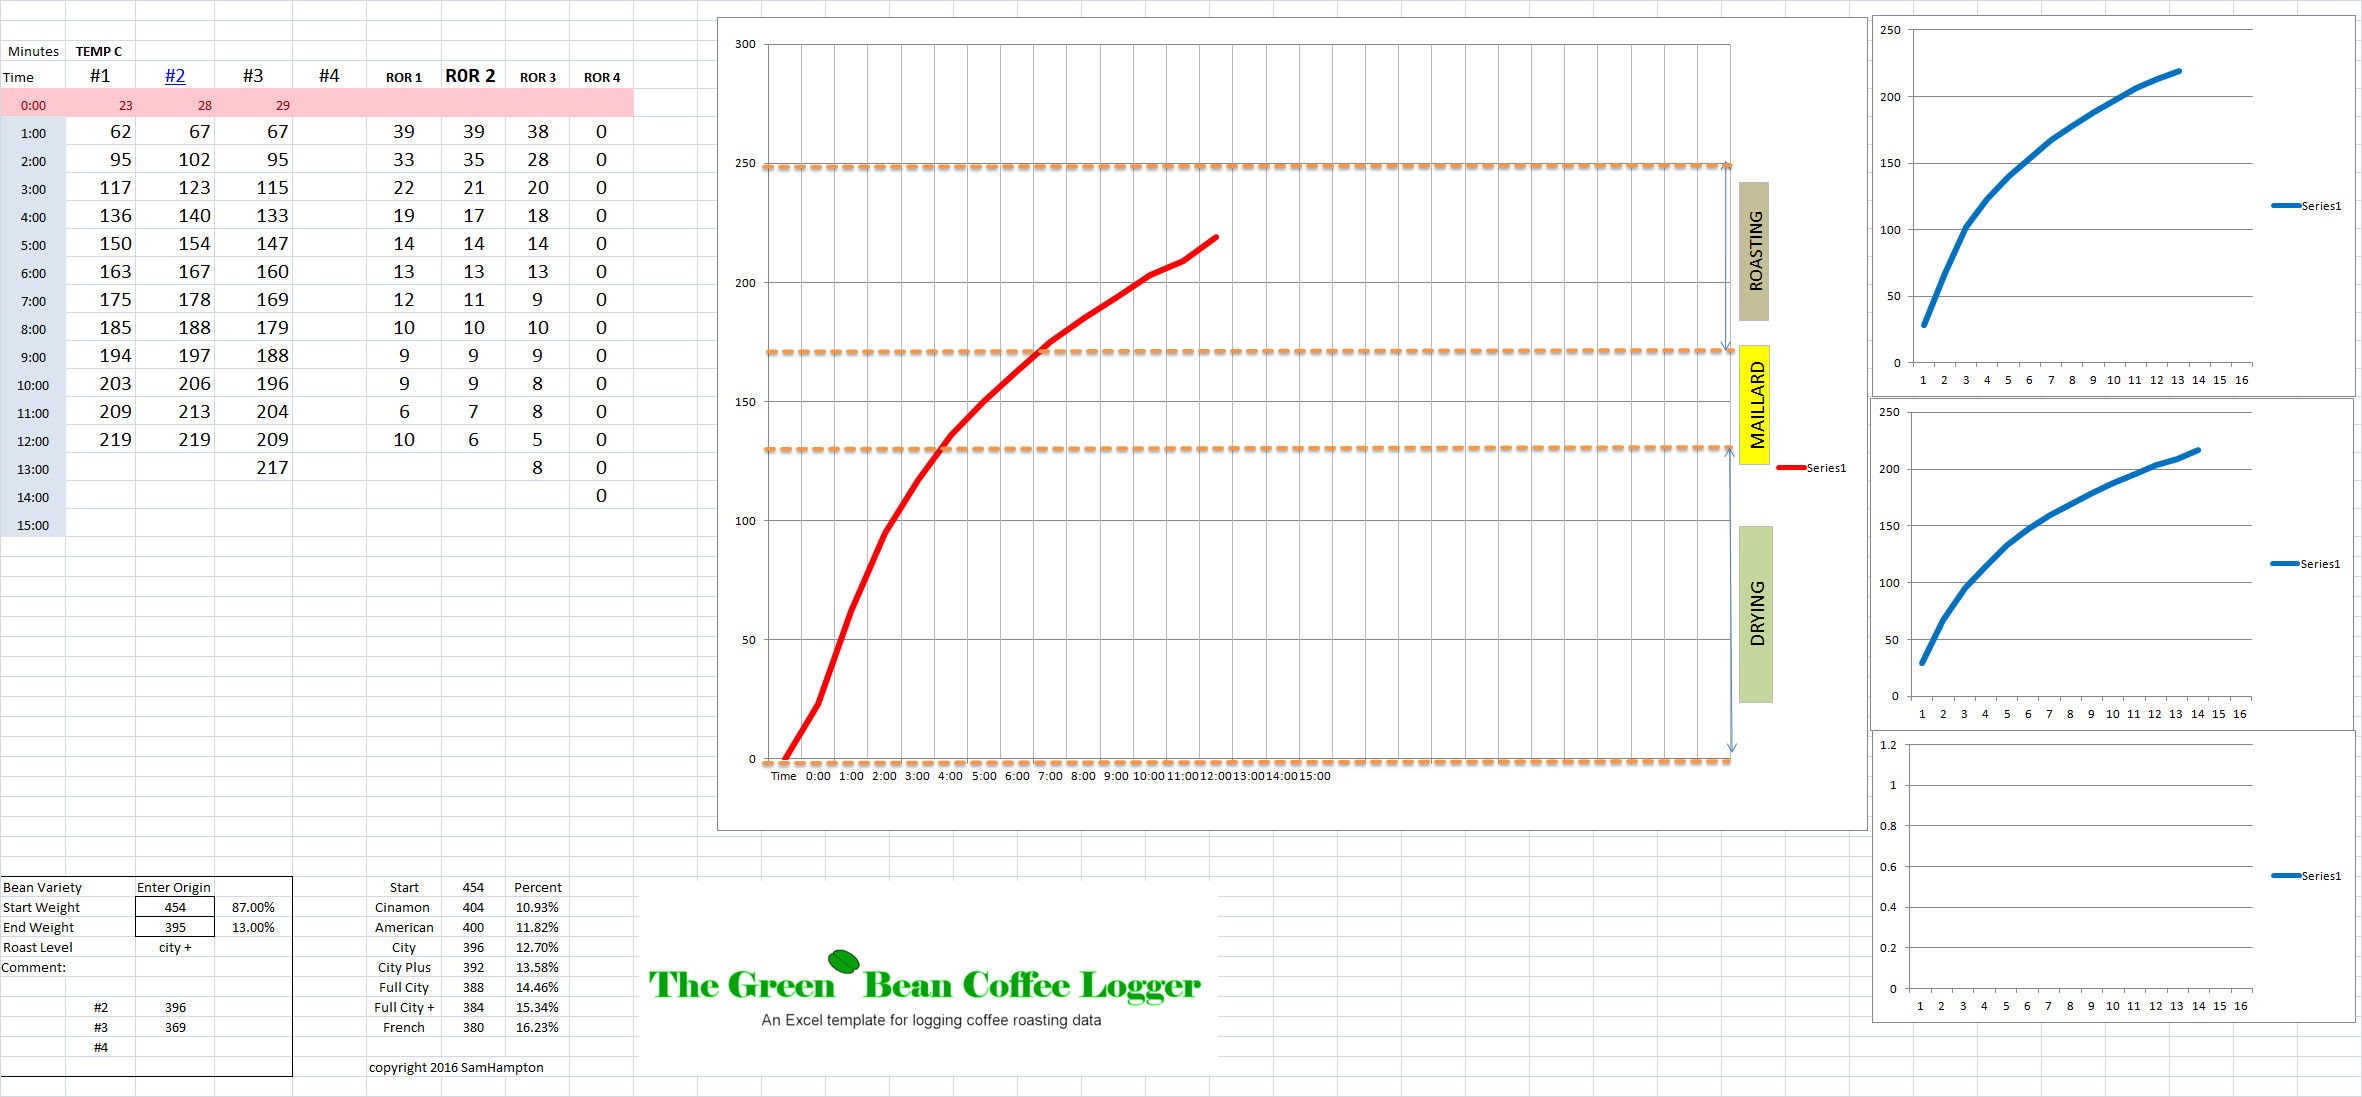
Click on the image for a screenshot of the full-size Green Bean Coffee Logger.
Line charts for each roast temperature data are automatically generated. Line charts for the ROR data must be highlighted and generated manually.
I roast using centigrade temperatures and measure batches in grams. The charts have helped me understand the roasting process so that I can obtain more consistent results with my roasting.
The Green Bean Coffee Logger and the New Minute Green Bean Coffee Logger are available as an XLSM download below.
May you enjoy many great roasts. SH
Resources
The Green Bean Coffee Logger and the New Minute Green Bean Coffee Logger – Excel (XLSM) file in Zipped format.
Home Roasting Coffee with a Heat Gun and Bread Machine – A guide to home roasting coffee with a heat gun and a bread machine.